Service Insured Architecture, Part 1.
This part will introduce a new concept, called Service Insured Architecture. I will describe some scenario's and the overall concept together with a worked out example, in which I estimate the actual value of a service portfolio. The next part will go into more detail of:- setting priorities;
- evaluate risks;
- and delegate concerns.
What is Service Insured Architecture (SIA)
After the resurrection of SOA, the future of SOA is still gloomy. Organisations are building (web)services without a thorough awareness and understanding of the projected business value and the possible financial risks. SIA is a concept to mitigate the financial risks to insure the projected business value of a service portfolio.Scenario's
Let's assume I have a client who wants to optimise his business process 'quote to order'. Let's also assume that this client is convinced that service orientation will help him do the job. Finally, let's also assume that 6 entity services (contact, person, contract, content, account, employee) and 2 task services (product quotation, product ordering) will actually do the job.If I would build these 8 services into one service portfolio (SP) to support this business process, I could run into the following scenario's:
| scenario | impact | |
| 1 | Each software activity from specification to acceptance exceeds it's time-box with 25% (for instance caused by poor requirement analysis or being unaware of SAVARA). | reduction of NPV by 50% |
| 2 | Insufficient practice of SOA-patterns increases the maintenance effort for the next SP. A total of 5 SP's is projected in future time. Maintenance time will be increased per service up to 1 hour a week (for instance caused by poor identification of XSD complex types / poor schema centralisation). | reduction of NPV by 50% |
| 3 | Insufficient practice of SOA-patterns increases the total of versions to 3 versions a year (for instance caused by poor information analysis and/or poor requirement analysis). | reduction of NPV by 50% |
Of course, a combination of the above scenario's would vaporise the NPV at all.
How does SIA add value
By applying SIA, the risks of the service portfolio will be assessed and hedged. SIA therefore needs an additional neutral arbiter (NA) who will insure the projected value to the service consumer; in this case insures an NPV of 525365 Euro. To make it happen, the NA certifies each service from the service provider and directs governance during the life cycle of the service portfolio (SP). The simple 'blue' graph* below depicts this 'happy' SIA-scenario.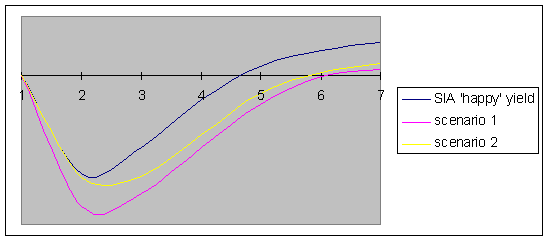
or we run into gloomy scenario 2 (e.g. caused by poor schema centralisation); then the 'yellow' graph above depicts the outcome.
The general idea is that SIA will prevent the above two gloomy scenario's by constantly monitoring value and applying strict governance; of course together with insuring projected NPV upfront.
Introduction to SIA
Before going into detail of SIA (next part), I will first elaborate on some terms and definitions.
Initial costs per service
These are the costs for delivering specifications, the service contract, the service design, the actual build, the deploy and test of the service, the certification and the final acceptance. It is important that the whole process is being monitored and time-boxed. Since a typical service portfolio (SP) consists of multiple services – in this case 8 – exceeding time-boxes could vaporise the actual value of the SP.
Decomposition factor per service portfolio (SP)
A typical SP should be matched to a specific type of business. For instance, the sale of a certain product type for a certain business label. The matching SP then supports the quotation and order process. In this example, I use two composite business services, each using six entity services: contact, person, contract, content, account, employee.
Reuse ratio per service portfolio (SP)
A typical SP consists of reusable services. For instance, for managing contacts, persons, content, accounts and employees. In this example, I focus on a modest ratio of 25%; meaning that 25% of the functionality of the SP can be reused. This creates just a little bit of inventory. Each additional SP enhances the total amount of reuse.
Reuse impact per SP
Within the reuse rate per SP, I assume that each SP supports only a part of the whole costs of reusable services. In this case I use a modest ratio of 20%; meaning that I focus on a total amount of 5 SP's that share the reusable parts.
Number of versions a year.
Because building a SP means sharing functionality and steering on reuse, the next SP might cause a next version of the deployed service of the former SP. In this case, I assume that I build only one additional version a year. Building more then two new versions a year could easily vaporise the value of the SP. Strong governance is therefore needed to constrain the number of versions a year.
Illiquidity factor per SP
Holding a SP is like holding an asset; however, an asset which can not be traded or which can not be hedged by going short on a same type of available market asset. Holding a SP therefore carries a risk; it is not easy – even hard - to sell or trade a deployed SP. The costs of this risk is hold on a illiquidity premium (IP). In this case, I hold 10% of SP costs as the IP.
Number of business transactions per SP per year
A typical SP supports a business process chain (BPC); in this example, the quotation and order process of a product type on a business channel. To support this BPC, the SP as an asset is matched as a liability to the BPC. To enforce this contract, each service has its service contract. In this example, the BPC handles 2500 business transactions a year.
Sales per business transaction (BT)
In this example, each BT is worth 1000 Euro on sales. Total sales: 2500000 Euro per year.
Profit ratio per BT
In this example, each BT is worth 250 Euro on profit. Annual yield: 625000 Euro.
Annual maintenance costs
Each SP needs maintenance. Think about the product life cycle of the supporting infrastructure; each new release of the operating system, DBMS, ESB, BPMS, application server, etc. could cause maintenance costs. Also think about re-factoring after deployment of the SP; assuming the service has a correct façade, so maintenance work can be isolated. In this case I reserve a modest 110000 Euro for maintenance costs, less then 2500 Euro a week for the whole SP. To constrain the amount of maintenance, strict governance is needed.
Annual service insurance premium per SP
Since the SP can not be hedged in the market (not a liquid asset), another hedging technique is needed. For insuring the liability of the SP to the business process chain (BPC), the liability is matched by a more secure asset; an asset which is liquid (e.g. government bonds). This securing asset is being hold by a neutral arbiter (NA). The NA guarantees that the costs of the SP are being constrained; in this case: 1300000 Euro. The NA also guarantees that if the SP loses value - for instance does not deliver it's promised features (reuse, flexibility, stability, performance, etc) – the NPV is being paid to the service consumer, the owner of the BPC. In this case, an annual premium of 40000 guarantees a NPV of 525365 Euro after surrendering the SP after 5 years.
The NA also charges certification costs per service; in this example 5000 Euro per service, 40000 Euro per SP. In case a certification of a service fails, the service provider is responsible for correcting any major issues. These issues could be related to the the service implementation, the service contract, the service messaging, but could also be related to the specification and/or design process. The NA can not be hold responsible for insurance claims by the service consumer (SC) if the service provider refuses to correct the issues. For correcting certification issues, the service provider is also responsible of holding a technical provision (a financial reservation to insure delevering the liability). In this case 25% of the nett service portfolio, or 250000 Euro. The technical provision has to be calculated in the NPV as a negative cash flow.
The picture below depicts the whole process of SIA.

Identify hazards
During the earlier introduction, I have made it clear that there are quite a few risks that need to be managed. I mentioned time-boxing, monitoring, governance and hedging as instruments to manage risks. However, the biggest risk of all is applying service orientation without a clear understanding of the business value. You can be sure that applying service orientation merely from a technical point of view, the actual value will be vaporised by exceeding costs on initial deployment and maintenance. This risk will be managed by SIA.
Estimate value
In the example below, the service portfolio (SP) generates value during a lifespan of 5 years.
Operational assumptions | facts | Euro |
|---|---|---|
| ||
| 40000 | |
| 15000 | |
| 15000 | |
| 20000 | |
| 15000 | |
| 15000 | |
| 5000 | |
| 125000 | |
| 8 | |
| 25.00% | |
| 20.00% | |
| 2 | |
| 25.00% | |
| 10.00% | |
| 1300000 | |
| 25.00% | |
| 250000 | |
| 2500 | |
| 1000 | |
| 25.00% | |
| 625000 | |
| 110000 | |
| 40000 | |
| 3.00% | |
| 5 | |
| 525365 |
** calculation of total initial costs per SP
(((125000 x 8) + 250000) – 50000) + 100000 = 1300000 Euro
*** calculation of annual yield per SP
(2500 x 1000) / 4 = 625000 Euro
**** calculation of NPV
475000 / 1,0300 = 461165
475000 / 1,0609 = 447733
475000 / 1,0927 = 434703
475000 / 1,1255 = 422034
475000 / 1,1593 = 409730
-1300000 – 100000 - 250000 + 461165 + 447733 + 434703 + 422034 + 409730 = 525365
